
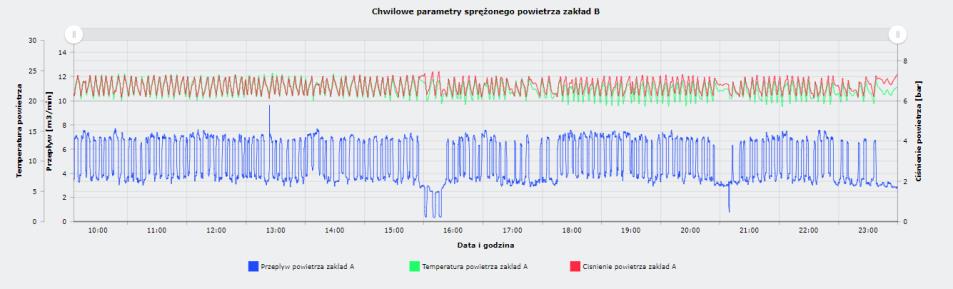

iPLAS zbiera dane z maszyn i procesów – zarówno automatycznych, jak i manualnych – w czasie rzeczywistym, abyś miał wszystko w jednym miejscu.
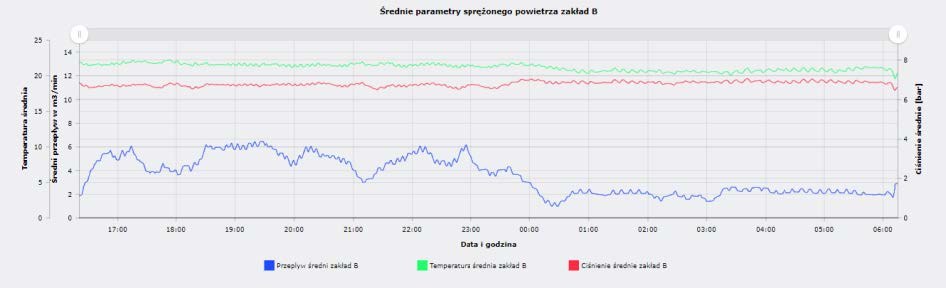
Integrujemy wiele fabryk w jednym środowisku i bezpiecznie przechowujemy dane w chmurze lub na Twoim serwerze.
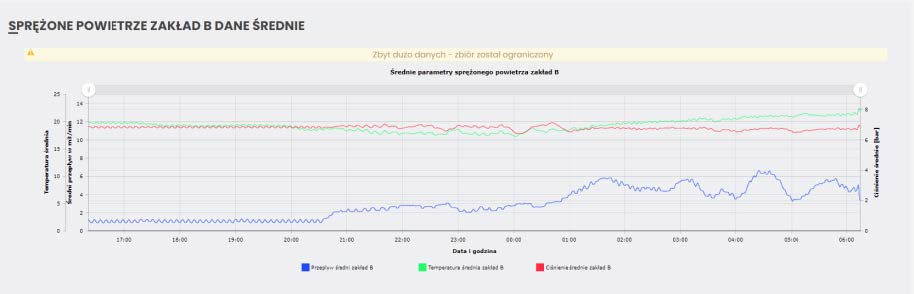
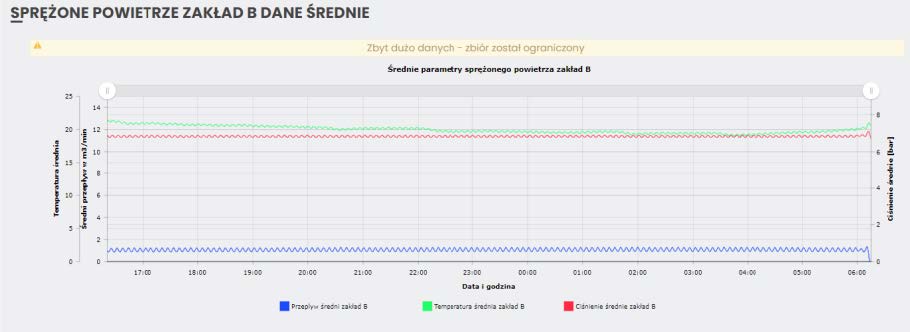
Dzięki procesowi ETL łączymy dane z różnych źródeł. Ty analizujesz i wizualizujesz je w dowolnej formie.