Introduction
A Gantt chart is one of the most popular and effective project management tools, which also finds application in manufacturing. It is a graphical method of representing a production schedule, showing production tasks and stages, their sequences, dependencies, deadlines and progress.
A Gantt chart allows for better visualisation of production processes, identification of delays and problems, communication between team members, and optimisation of planning and resource allocation.
In this article, we will discuss what a Gantt chart is, what its main features and benefits are, what elements a Gantt chart tailored to production needs should contain, and what tools and systems offer integrated Gantt chart functions for manufacturing.
What is a Gantt chart and what are its main features?
The Gantt chart was developed by Henry Gantt in the early 20th century as a way to graphically represent a project schedule. The chart consists of two axes: a vertical one, which lists tasks or production stages, and a horizontal one, which shows time units (e.g. days, weeks, months).
Each task or stage is represented by a rectangle (often called a block or bar), the length of which corresponds to the duration of the task or stage.
The blocks can be connected by arrows or lines that indicate dependencies between tasks or stages (e.g. task B cannot start until task A is completed).
The chart can also show the progress of each task or stage by filling the block with colour or adding a percentage sign. Thus, a Gantt chart enables easy tracking of production status and schedule.
What are the benefits of using a Gantt chart in production management?
A Gantt chart is not only a simple and intuitive way to present a production schedule, but also a powerful tool for optimising production processes. Here are some of the main advantages of a Gantt chart:
- Better progress visualisation: A Gantt chart allows you to quickly and easily check how production is progressing, which tasks or stages are already completed, which are in progress, and which are still to be done. You can also compare the planned and actual duration of each task or stage and assess the degree of achievement of production targets.
- Ease of identifying delays: A Gantt chart makes it easy to detect delays and problems in production that could have a negative impact on the timeliness and quality of deliveries. You can also identify the causes of delays and take appropriate corrective or preventive actions.
- Improved communication between team members: A Gantt chart fosters better communication and collaboration among production team members by providing a shared and transparent view of the production schedule and progress. A Gantt chart also facilitates the transmission of information and instructions, conflict resolution, and monitoring and evaluation of team performance.
- Support in resource planning and allocation: A Gantt chart helps in effective planning and allocation of production resources, such as machinery, materials, people, energy, etc. A Gantt chart allows you to determine resource requirements in different phases of production and to adjust their availability and utilisation to changing conditions and needs. A Gantt chart can also help in optimising production costs and profits.
What elements should a Gantt chart tailored to production needs contain?
A Gantt chart can be adapted to different types and scales of production, depending on the specifics of the industry, product, process, etc. However, there are certain elements that are essential or desirable for any Gantt chart designed for production management and optimisation. Here are some of them:
- Production tasks and stages: These are the basic units of work that make up the entire production process. Each task or stage should be clearly defined, named and described so that there is no ambiguity or inconsistency. Tasks and stages should also be broken down into appropriately small and manageable pieces so that their progress and duration can be easily tracked.
- Sequences and dependencies: These are the relationships between production tasks or stages that determine their order and conditions of execution. Sequences and dependencies should be logical and consistent with the nature of the production process and business objectives. Sequences and dependencies should also be flexible and changeable if necessary.
- Resources: These are any means that are necessary or useful for carrying out production tasks or stages. Resources can be tangible (e.g. machinery, materials, tools) or intangible (e.g. people, energy, information). Resources should be precisely defined, measured and allocated to each task or stage in an optimal and efficient manner.
- Deadlines: These are dates or periods of time within which production tasks or stages should be started, completed or reach a certain level of completion. Deadlines should be realistic and agreed with customers and other stakeholders. Deadlines should also be monitored and updated as necessary.
- Progress: This is a measure of the degree of completion of production tasks or stages in relation to planned deadlines and targets. Progress should be regularly measured, reported and analysed to assess the status and quality of production and to take appropriate corrective or improvement actions.
How does a Gantt chart affect the optimisation of production processes?
A Gantt chart is not only a tool for presenting a production schedule, but also for optimising production processes. A Gantt chart can be used to identify possible improvements in production, risk management, and the minimisation of waste and losses. Here are several ways in which a Gantt chart affects the optimisation of production processes:
- Reducing downtime: Thanks to precise planning and monitoring of production on a Gantt chart, potential downtime and production delays can be identified, and appropriate actions can be taken to minimise or avoid them.
- Improving quality: A Gantt chart can help identify production stages that require additional attention or quality control, which in turn leads to a better end product.
- Efficient resource utilisation: Analysing a Gantt chart allows for better allocation of resources, such as machinery, personnel or materials, depending on current production needs.
- Risk management: A Gantt chart can be used to predict potential problems or risks in production, allowing for early detection and taking appropriate countermeasures.
- Increasing flexibility: A Gantt chart makes it easier to adapt to changing conditions, such as unexpected changes in material supplies or sudden increases in demand.
Improving communication with stakeholders: Thanks to the visual representation of the production schedule, a Gantt chart enables better communication with customers, suppliers and other stakeholders regarding progress and order delivery deadlines.
When do IPLAS system users use a Gantt chart?
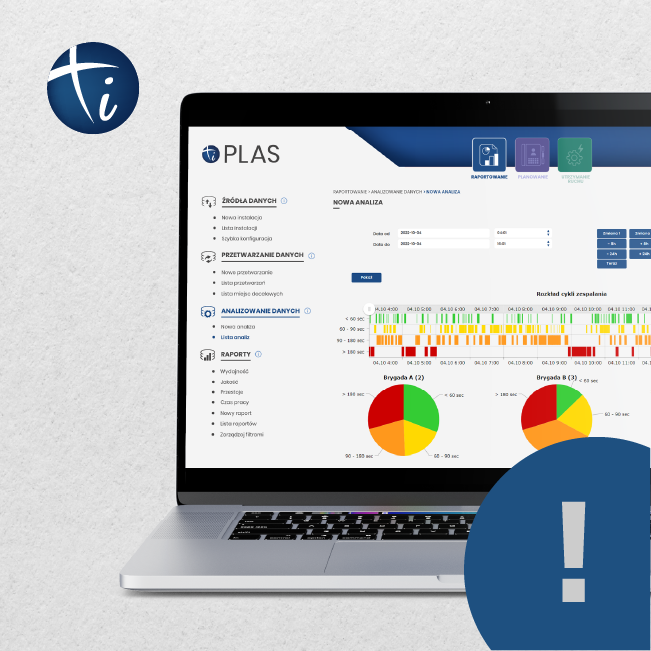
Our customers most frequently use a Gantt chart to analyse line operation, in terms of its changing operating mode or assumed performance thresholds. They observe when problems occur during production and when production is running smoothly.
By recording the causes of downtime and slowdowns, operators can thoroughly analyse and comment on these events. The result of this process is the creation of detailed reports on downtime duration, with precise indication of their causes. The start and end times of these events are determined based on data that, in most cases, is retrieved directly from the machines. This eliminates the risk of operator errors.