Introduction
The growing volatility of electricity prices has become one of the most pressing challenges for manufacturing plants in Poland. In energy-intensive industries – from glassworks to aggregate processing plants – the cost of a MWh can determine margins, or even whether production can be sustained. That is why we are increasingly hearing the question: how to plan production to use the cheapest energy and reduce cost risks?

The initial challenge
- High price volatility: the price of energy can change by up to several hundred percent within a single day.
- Lack of transparent real-time data: managers need a single “control dashboard” rather than several unsynchronised spreadsheets and portals.
- Limited line flexibility: many processes cannot simply stop “on the spot”, but part of the production (e.g. buffer operations) can be shifted in time.
The solution: energy price analysis and forecasting module in the iPLAS system
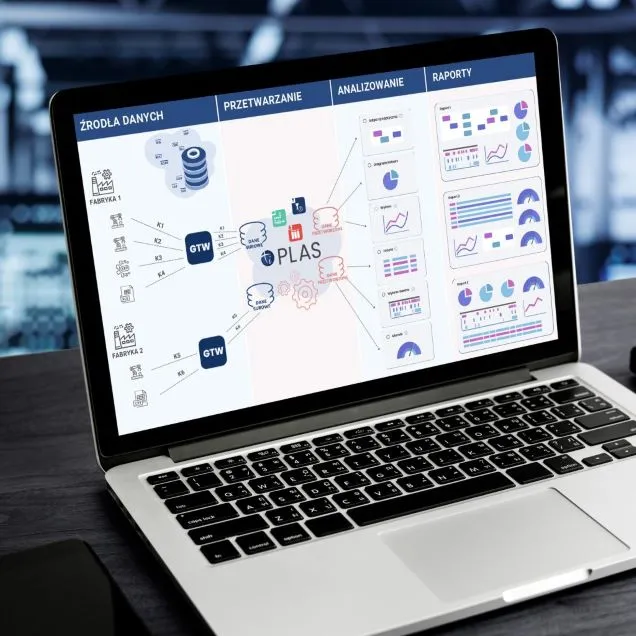
In response, we have expanded the Energy Consumption Analysis Module in the iPLAS system with a retrieval and visualisation mechanism for:
| Data | Source | Frequency | What do they provide? |
|---|---|---|---|
| RCE (market electricity price) | Polskie Sieci Energetyczne | daily around 14:00 | plan for the next day |
| Forecasted Price (intra-day) | Polskie Sieci Energetyczne | every 15 min, with a 45–90 min delay | ongoing plan adjustment |
| Energy consumption | MODBUS / MBUS / PROFINET meters | online | verification of plan execution |
How does it work in practice?
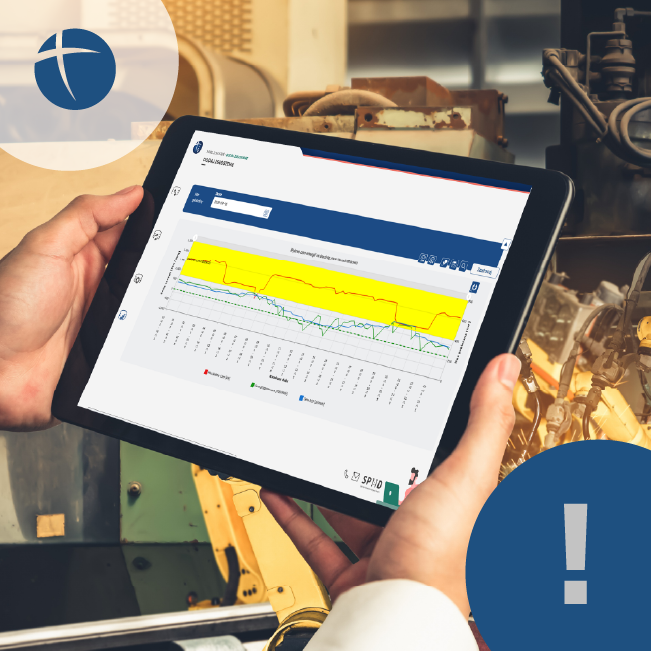
- RCE forecast import – after 14:00, the iPLAS system retrieves tomorrow’s prices and automatically highlights (in colour) quarter-hours above a set threshold (alert).
- Load simulation – the planner can see which lines can be “shifted” to cheaper hours.
- Live monitoring – during the day, the system updates the current “Forecasted Price”, allowing decisions to be adjusted every 15 min.
- Power overlay – actual consumption from meters is overlaid on the price; deviations from the plan are visible immediately.
Example scenario (simulation) – double glazing manufacturing plant
Note: the values below are hypothetical and are intended to illustrate the savings potential.
| Parameter | Before optimisation | After simulation implementation | Estimated effect* |
|---|---|---|---|
| Annual energy consumption | 7,000 MWh | 7,000 MWh | — |
| Average MWh purchase cost | 630 PLN | 510 PLN | -19% |
| Total annual energy cost | 4.41 million PLN | 3.57 million PLN | -840 thousand PLN |
*Savings result from shifting operations to hours with the lowest RCE price and avoiding capacity tariff peaks.
Simulation steps:
- The iPLAS system imports the RCE forecast and flags quarter-hours above 1,000 PLN/MWh.
- The planner creates a batch plan so that work cycles start in ‘green’ price windows.
- Power deviations are monitored in real time; in the event of a price spike (based on the ‘Forecasted Price’), the system suggests short downtimes for auxiliary equipment.
Who is it for?
- Glass and ceramics industry – kilns, dryers, tempering furnaces.
- Crystallisation and aggregate grinding – mills, crushers.
- Cold stores, freezers, HVAC – facilities operating on a cold buffer.
- Chemical industry.
Key business benefits
- Immediate – lower energy bill, no CAPEX (we use existing meters).
- Strategic – better position in negotiations with the energy supplier thanks to hard data on consumption vs prices.
- Operational – all key data in a single iPLAS system dashboard; no more ‘Excel ping-pong’.
FAQ – frequently asked questions about the price forecasting module in the iPLAS system
| Question | Answer |
|---|---|
| 1. How accurate are the energy price forecasts? | The system uses official PSE data – the market energy price (RCE) is published once a day, and the forecasted price is updated every 15 minutes with a 45–90 minute delay. In practice, deviations from the settlement price are usually < 5 %. |
| 2. What if the price changes rapidly during the day? | The iPLAS algorithm monitors PSE updates and can send an alert (SMS, email, push) suggesting a plan adjustment – e.g., a short mill shutdown or accelerating the kiln cycle. |
| 3. Will shifting production not degrade OEE or delivery deadlines? | Only operations with a technological buffer are shifted (e.g., glass tempering, aggregate grinding). Quality parameters of continuous processes (temp., humidity) remain under control; the OEE of main lines usually does not decrease, and often increases due to better capacity availability. |
| 4. What energy meters are required? | Devices with MODBUS RTU/TCP, MBUS, PROFINET or IEC 62056-21 protocols are sufficient. If the plant has older meters, iPLAS can retrieve data via a communication gateway. |
| 5. How long does implementation take? | A typical schedule is 4–6 weeks: 1) audit of meters and network → 2) PSE API connection and threshold configuration → 3) dashboard parameterisation → 4) user training and dry runs. |
| 7. Does the solution also work with on-site photovoltaics or energy storage? | Yes. iPLAS can take into account the storage SoC (State of Charge) to further optimise grid consumption and surplus sales. |
| 9. What about the security of production data? | Communication takes place via VPN or HTTPS with AES-256 encryption; all data is stored in an ISO 27001 data centre (on-prem or cloud). |
| 10. Can the module be integrated with an existing ERP or SCADA? | Yes – REST/OPC UA connectors and CSV/XLS files are available. Two-way control is also possible (e.g., automatic batch plans sent to the PLC). |
Summary
The dynamic energy market forces flexibility, but at the same time opens up space for real savings. The price forecasting module in the iPLAS system allows you to shift energy-intensive operations to the cheapest quarter-hours of the day, monitor plan execution in real time, and reduce production costs by up to a dozen or several dozen percent. If you want to check the potential hidden in your plant, get in touch – we will prepare a free simulation analysis.